
AI marketer. Alan
An idea is just a wish to do something: “why don't we add a button?” A hypothesis is a statement that can be tested and disproved.
Level: for beginners
Language: Russian
Duration: 3:29
Today we'll look at how a product team decides what to do next: not at random, but through hypotheses.
An idea is just a wish to do something: “why don't we add a button?” A hypothesis is a statement that can be tested and disproved. The formula goes like this: “If we make a certain change, a specific metric will shift by a specific amount, because we assume that users will behave in a certain way.” Without a specific metric and without an explanation of “why,” it is not a hypothesis but a slogan.
To work with hypotheses systematically, teams use the HADI cycle. The name is an acronym of its four stages: Hypothesis, Action, Data, Insight. At the first stage, we formulate the hypothesis as clearly as possible and immediately record which specific metric we will use to evaluate the result. At the second stage, Action, we take the smallest possible step to test it: instead of building a full-fledged feature, we run a small, cheap test. At the third stage, Data, we collect data on the metric chosen in advance. And at the fourth stage, Insight, we draw a conclusion: the hypothesis was confirmed, it was disproved, or another round of testing is needed.
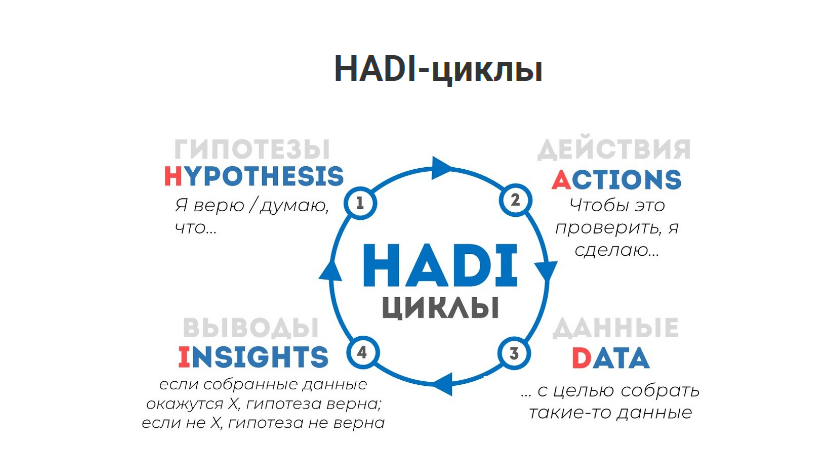
There is an important nuance here: a negative result needs to be analyzed just as carefully as a positive one. Always ask yourself whether the hypothesis really failed or whether it is simply ineffective under these particular conditions. And vice versa: if a test showed growth in the metric but the change was never rolled out permanently, the resources were wasted. The HADI cycle never ends: as soon as one hypothesis has been tested, the next one is taken on, and so on, round and round. This is what a systematic approach to product development is all about.
The problem is that there are always more hypotheses than the team has hands and time. That's why they get prioritized, and there are two main tools for this.
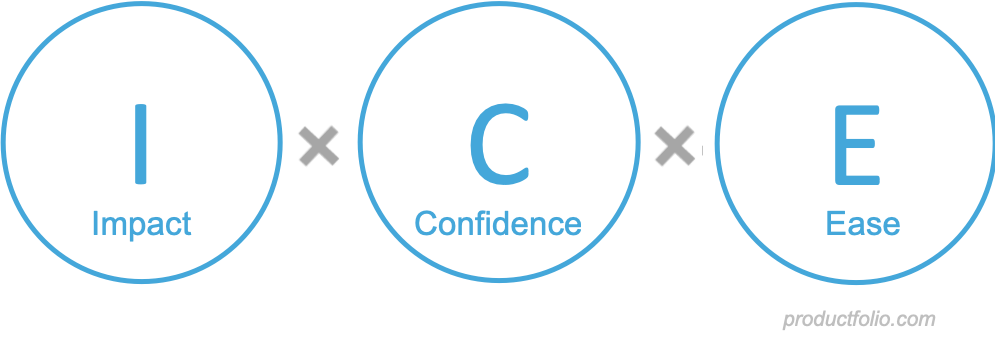
The first is ICE. The acronym stands for Impact, Confidence, Ease. Each hypothesis is scored on a scale from one to ten on three parameters: Impact (how strongly it will affect our target metric); Confidence (how sure we are that the predicted effect will actually happen, and whether we have data or past experience to back this up); and Ease (how easy and quick it is to implement technically). The three numbers are multiplied: ICE equals Impact times Confidence times Ease. Because this is pure multiplication rather than addition, a weak spot in even one parameter sharply drags down the whole score: a brilliant idea that is hard to implement will never get a high score, and this is a deliberate feature of the method.
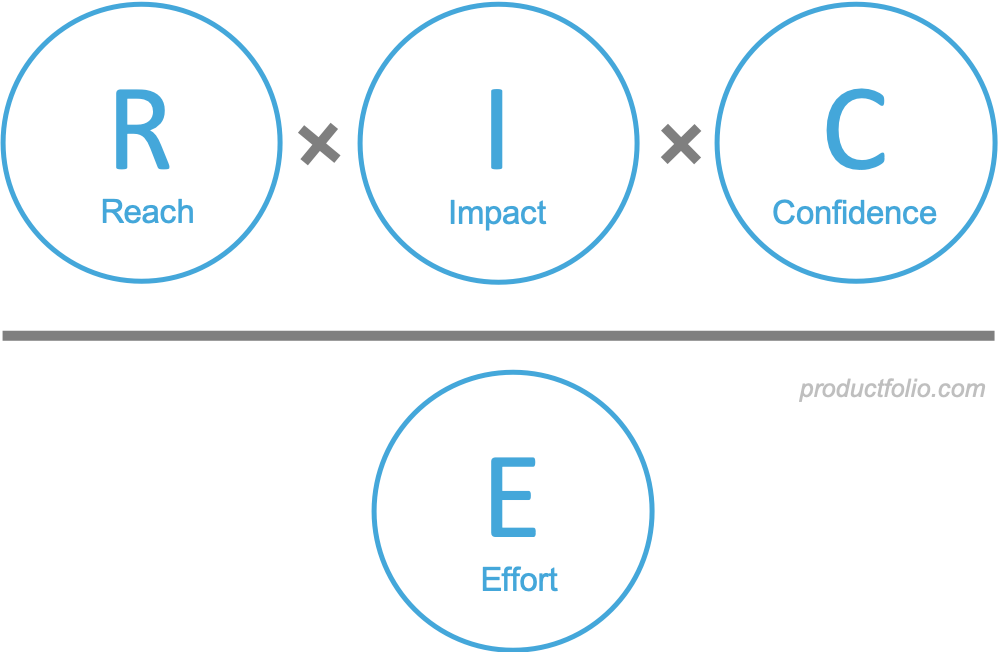
The second, more precise method is RICE: Reach, Impact, Confidence, Effort. Reach is how many users the hypothesis will affect over a specific period, for example a quarter: a concrete number, not a gut feeling. Confidence is the same idea as in ICE, but it is expressed as a percentage: 100% means high confidence and 50% means low, depending on how much real data we have. And Effort is the team's workload in person-months. The formula is RICE = Reach times Impact times Confidence, all divided by Effort. In other words, unlike ICE, there is division here, and this is crucial: the greater the effort, the lower the final score, even if the idea is excellent on every other parameter. That is exactly why RICE works better when you need to compare hypotheses with very different audience reach: in such a situation, ICE may mistakenly rank a minor local tweak above a large-scale change.
But whatever the method, the main rule applies: the hypotheses to test first are not the ones that are easiest to test, but the ones that carry the greatest uncertainty, that is, the ones that can either confirm or destroy the entire business model. That is what real prioritization is about.
Sources:

Please take 5 minutes to leave us a review


